Note
Click here to download the full example code
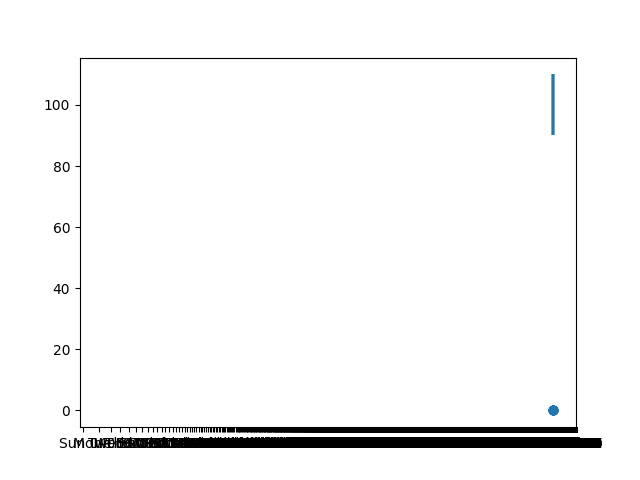
Problem with Non-Linear Scales and vlines
If a non-linear x-scale (e.g. "busday" or "log") is set before
calling Axes.vlines, Matplotlib may expand the axis limits excessively
and attempt to generate a very large number of ticks. This appears to be
related to how autoscaling interacts with the LineCollection created
by vlines and is not specific to busday.
Workarounds
- Add
vlinesbefore setting the scale, or - Set the x-limits explicitly before calling
vlines.
If you understand the underlying cause or have a robust fix, please contact the author.
import matplotlib.dates as mdates
import matplotlib.pyplot as plt
import numpy as np
import pandas as pd

import busdayaxis

busdayaxis.register_scale()

dates = pd.bdate_range("2025-01-01", periods=20)
returns = np.random.default_rng(42).normal(0, 0.01, len(dates))
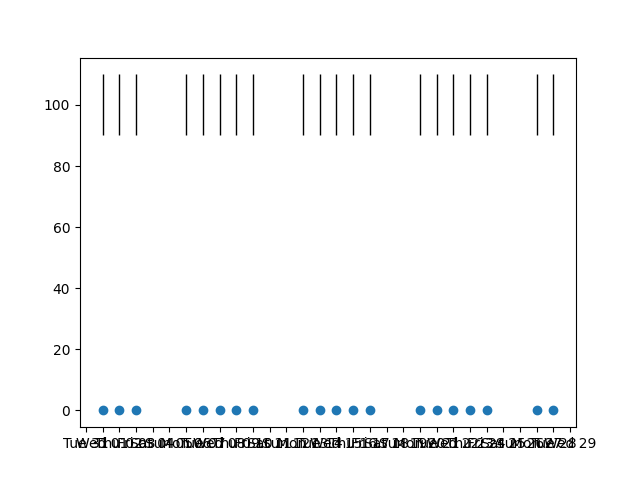
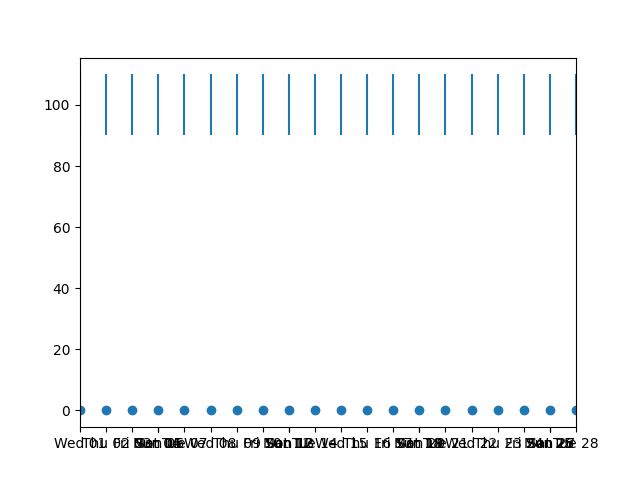
This works
fig, ax = plt.subplots()
ax.vlines(dates, 90, 110, linewidth=1, color="black", zorder=3)
ax.set_xscale("log")
ax.xaxis.set_major_locator(mdates.DayLocator())
ax.xaxis.set_major_formatter(mdates.DateFormatter("%a %d"))
ax.scatter(dates, returns)
Out:
<matplotlib.collections.PathCollection object at 0x10b8a67b0>
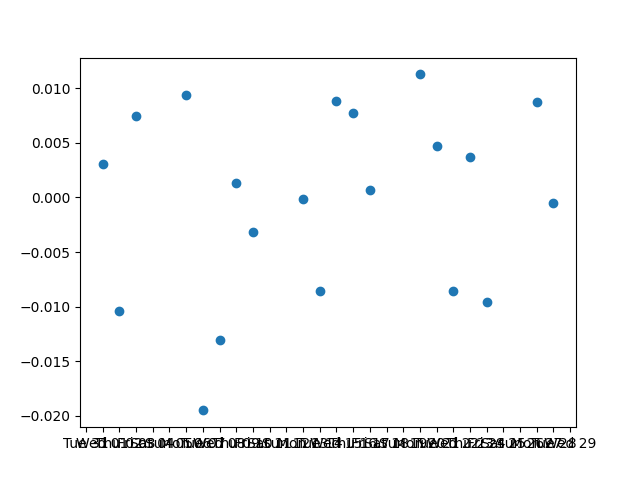
This works
fig, ax = plt.subplots()
ax.set_xscale("log")
ax.xaxis.set_major_locator(mdates.DayLocator())
ax.xaxis.set_major_formatter(mdates.DateFormatter("%a %d"))
ax.scatter(dates, returns)
Out:
<matplotlib.collections.PathCollection object at 0x10b9a79d0>
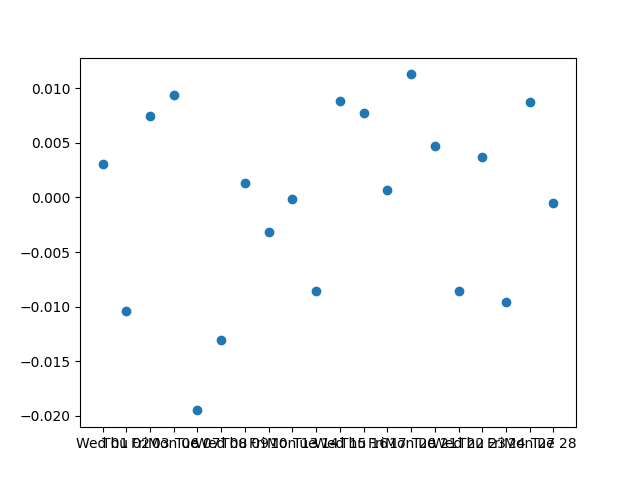
This works
fig, ax = plt.subplots()
ax.set_xscale("busday")
ax.xaxis.set_major_locator(busdayaxis.DayLocator())
ax.xaxis.set_major_formatter(mdates.DateFormatter("%a %d"))
ax.scatter(dates, returns)
Out:
<matplotlib.collections.PathCollection object at 0x10baac690>
This doesn't work
fig, ax = plt.subplots()
ax.set_xscale("log")
ax.xaxis.set_major_locator(mdates.DayLocator())
ax.xaxis.set_major_formatter(mdates.DateFormatter("%a %d"))
ax.vlines(dates, 90, 110)
ax.scatter(dates, returns)
Out:
<matplotlib.collections.PathCollection object at 0x10b91f390>
This doesn't work
fig, ax = plt.subplots()
ax.set_xscale("busday")
ax.xaxis.set_major_locator(mdates.DayLocator())
ax.xaxis.set_major_formatter(mdates.DateFormatter("%a %d"))
ax.vlines(dates, 90, 110)
ax.scatter(dates, returns)

Out:
<matplotlib.collections.PathCollection object at 0x15e1911d0>
This works
fig, ax = plt.subplots()
ax.set_xscale("busday")
ax.xaxis.set_major_locator(mdates.DayLocator())
ax.xaxis.set_major_formatter(mdates.DateFormatter("%a %d"))
ax.set_xlim(dates.min(), dates.max())
ax.vlines(dates, 90, 110)
ax.scatter(dates, returns)
Out:
<matplotlib.collections.PathCollection object at 0x10baafc50>
Total running time of the script: ( 0 minutes 40.969 seconds)
Download Python source code: plot_7_known_limitations.py