busdayaxis
A Matplotlib scale that compresses non-business days and off-hours. Every visible unit on the axis corresponds to active time — no gaps for weekends, holidays, or overnight periods. No data preprocessing needed.
Full documentation at saemeon.github.io/busdayaxis
Installation
pip install busdayaxis
Quick Start
import matplotlib.pyplot as plt
import pandas as pd
import busdayaxis

busdayaxis.register_scale()  # register once at the start of your script

dates = pd.date_range("2026-01-01", periods=10, freq="B")
values = range(len(dates))

fig, ax = plt.subplots()
ax.plot(dates, values)
ax.set_xscale("busday", bushours=(9, 17))  # compress weekends (Mon–Fri default) and off-hours (business hours: 09:00–17:00)
plt.show()
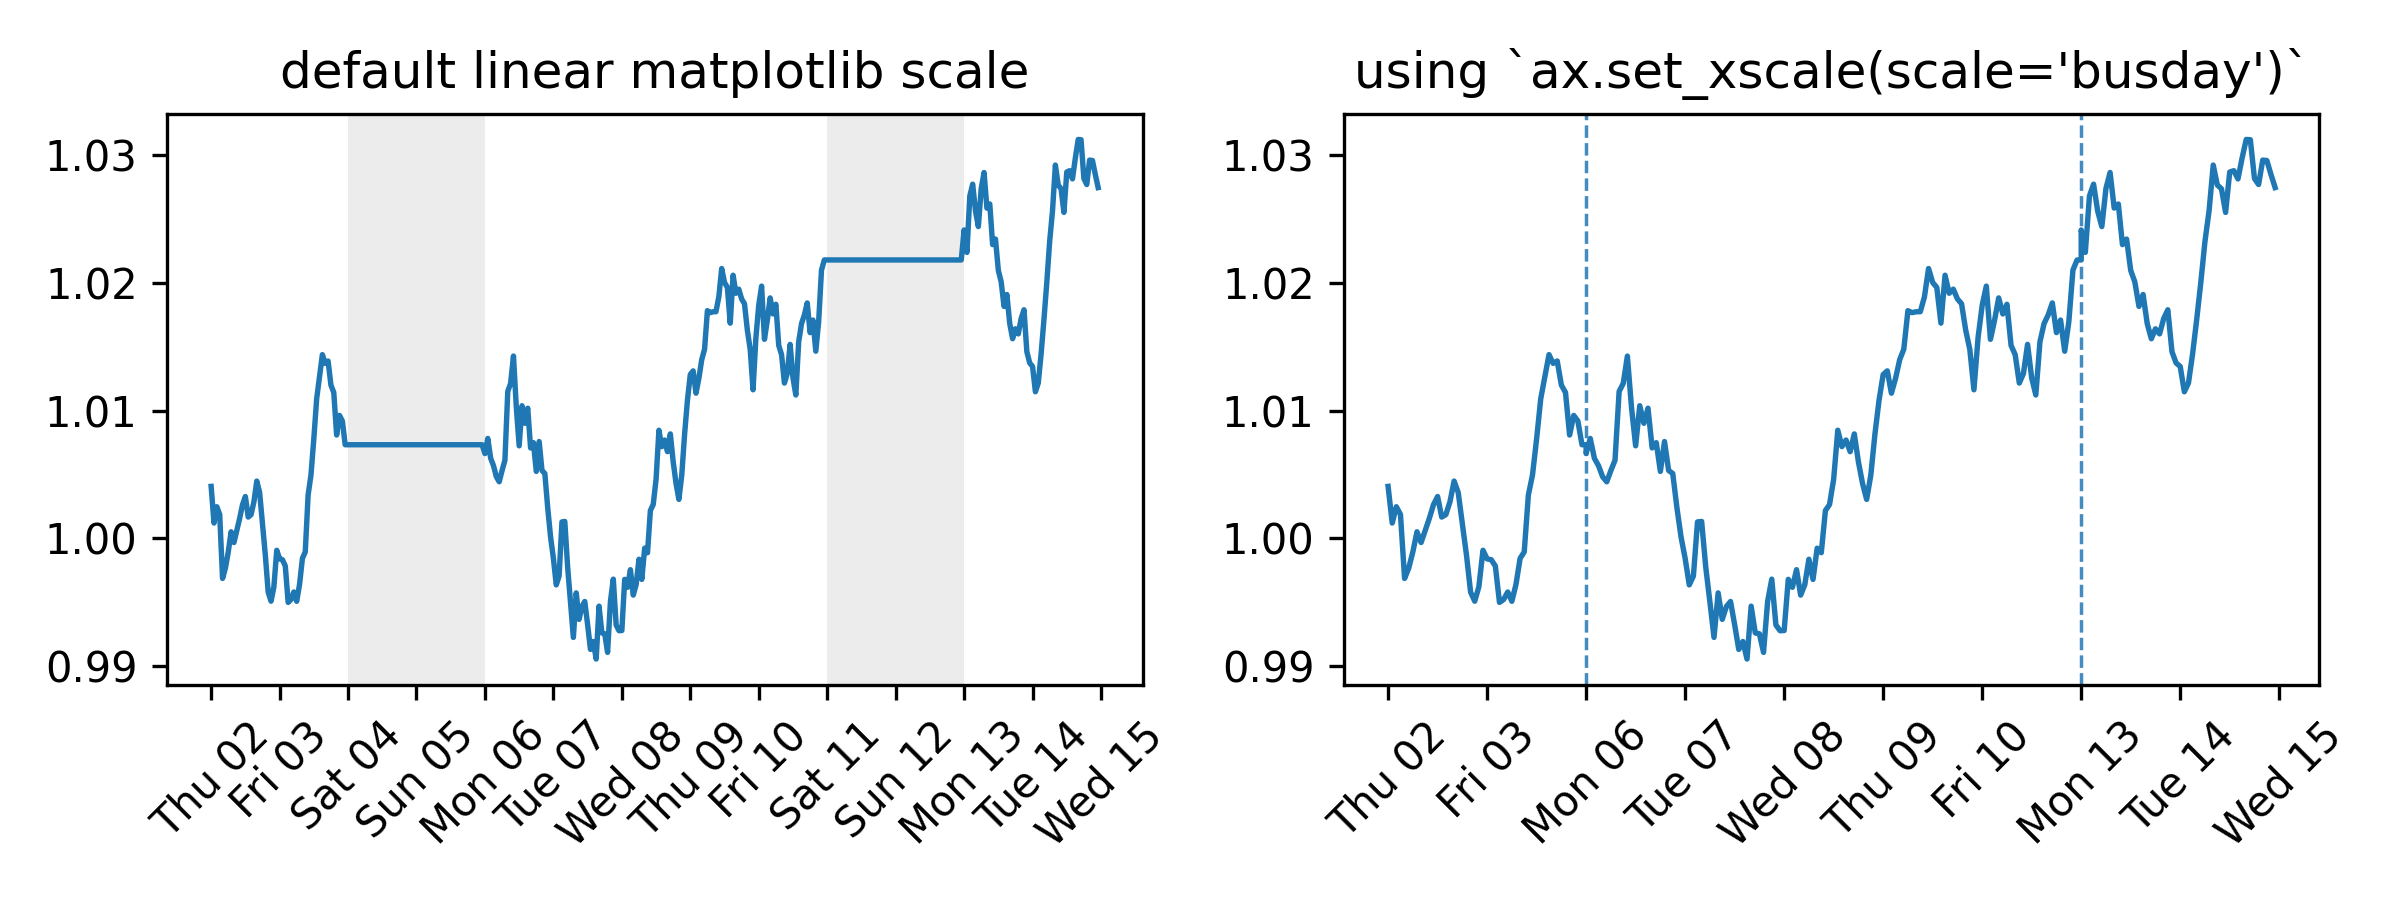
Why
Time series that only evolve on business days — prices, signals, operational metrics — look distorted on a standard calendar axis. Weekends and holidays introduce flat gaps that compress active periods and visually skew slopes. busdayaxis removes these gaps entirely.
What it provides
-
Compress weekends, holidays, and overnight gaps by adding an
axis scalewith a single call:ax.set_xscale("busday", weekmask=..., holidays=..., busdaycal=..., bushours=...)-
weekmask,holidays,busdaycal: standardnumpy.is_busdayparameters to configure which days are considered business days -
bushours: define uniform or weekday-specific business hours -
Implemented as a proper
matplotlib.scale— autoscaling, shared axes, and all standard artists work without any changes to your plotting code
-
-
Business-day-aware
DateLocatorwrappers for all standardmatplotlib.dateslocators — automatically filter out ticks on off-days and off-hours -
BusdayLocatorbase class to wrap any custom or third-party date locator with the same business-day filtering logic -
MidBusdayLocatorto place a tick at the midpoint of each business session, useful for centering day labels
Under the Hood
-
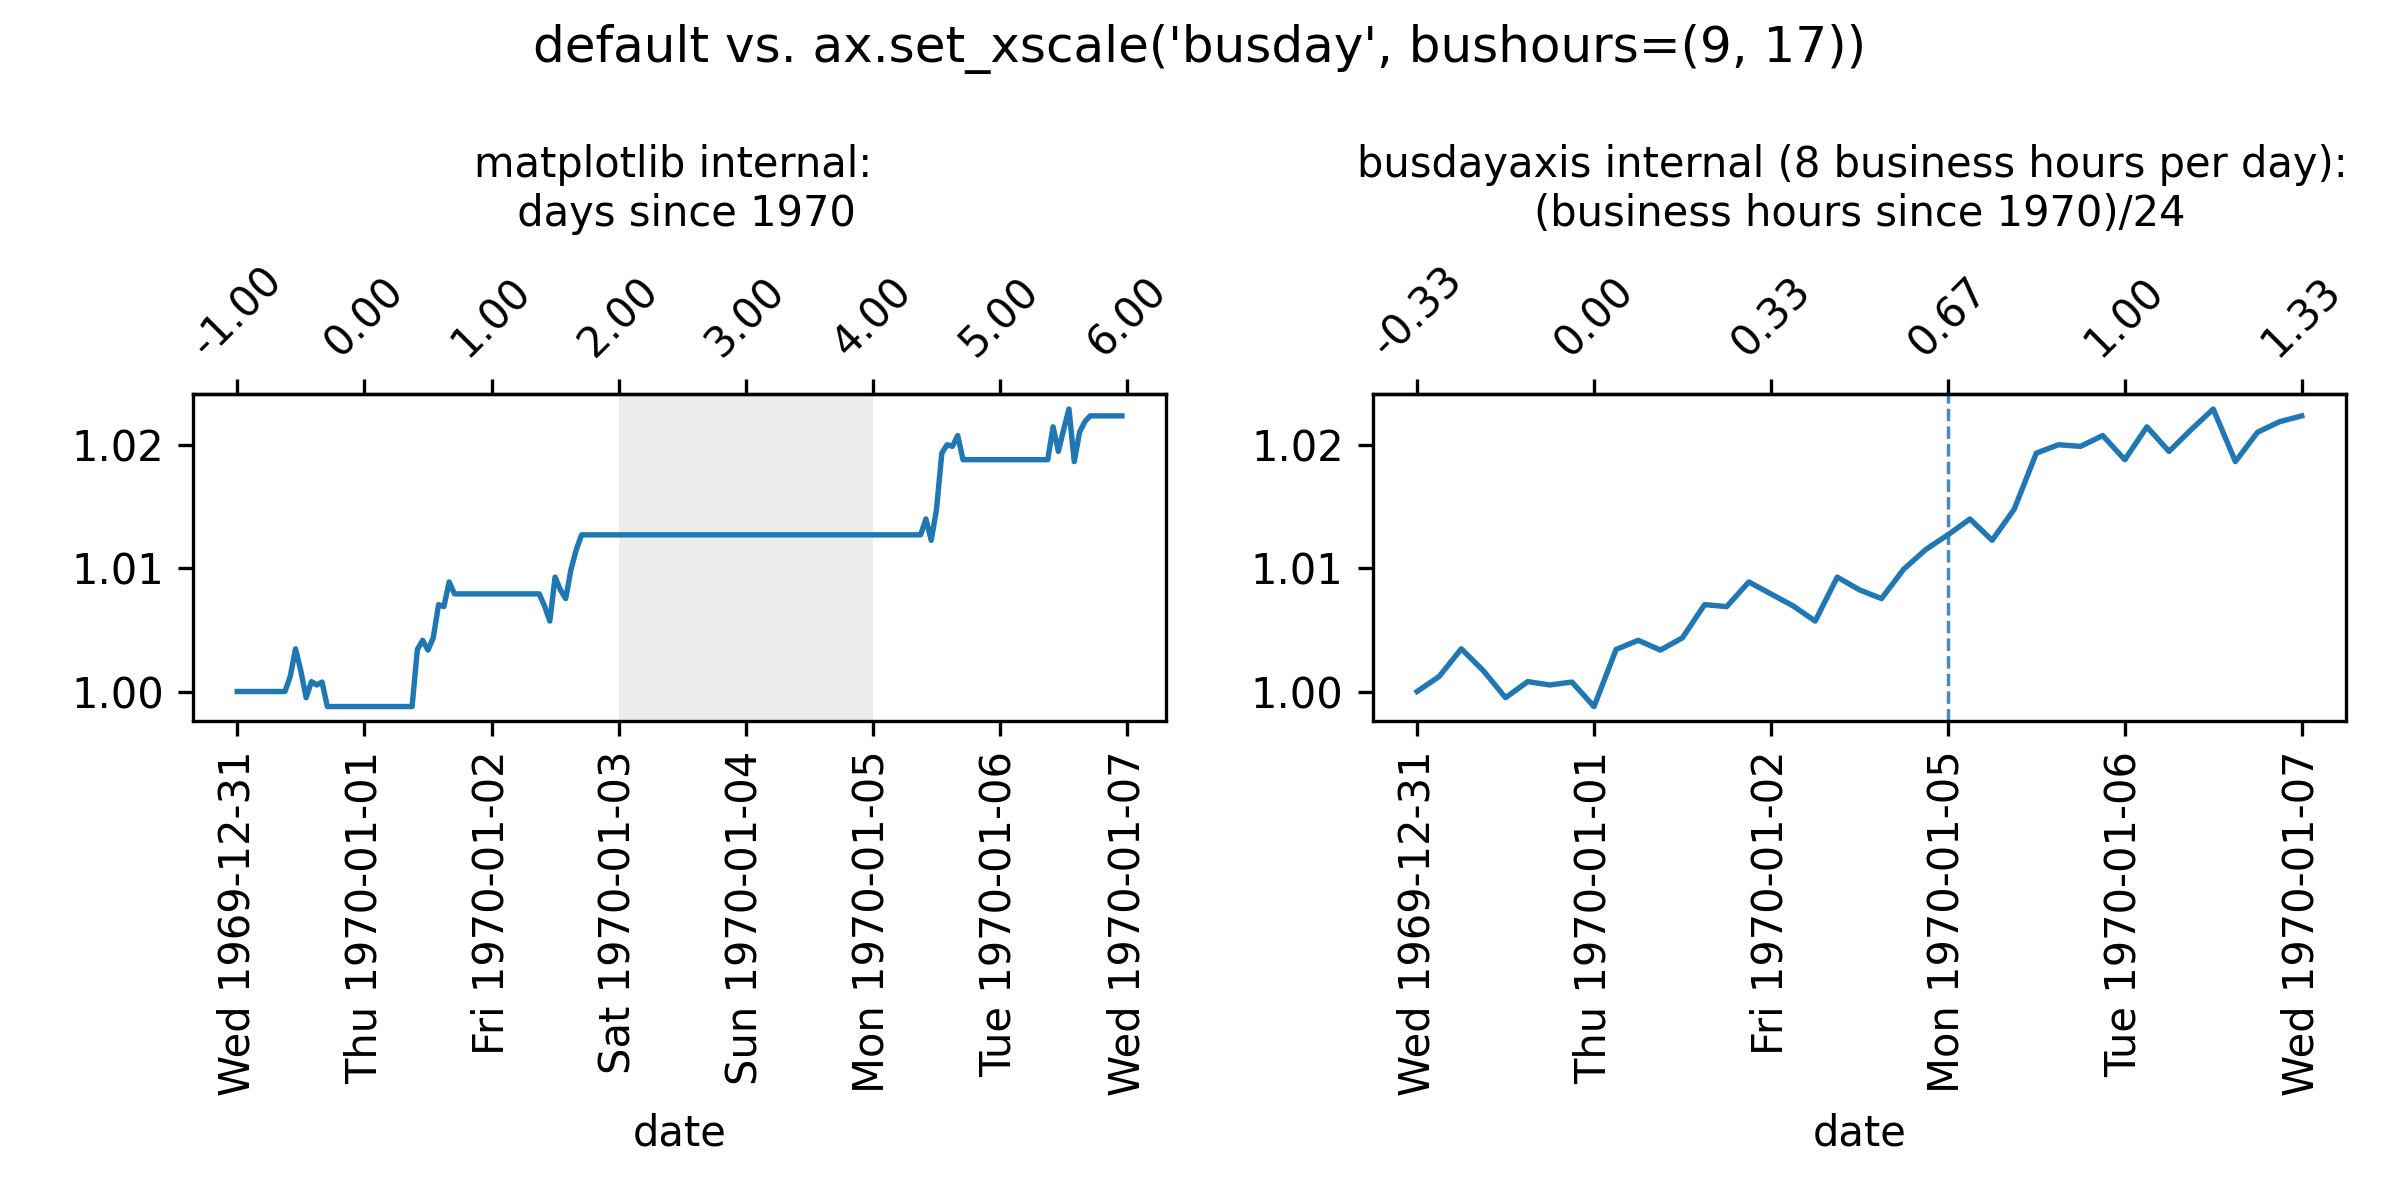
matplotlibinternally handles dates as floating-point numbers representing days since 1970-01-01, or stated alternatively, as $$ \text{matplotlib-representation} = \frac{\text{hours since 1970-01-01}}{24 \text{hours}} $$ -
busdayaxistransforms these coordinates to floating-point numbers representing $$ \text{busdayaxis-representation} = \frac{\text{business-hours since 1970-01-01}}{24 \text{ hours}} $$This conversion implies that datetime values that fall on non-business days or outside of business hours will be mapped to the same coordinate as the nearest preceding business hour. For example, if business hours are defined as 9:00 to 17:00, then "1970-01-05 08:00" (Mon 08:00) is mapped to the same coordinate as "1970-01-05 09:00" (Mon 09:00), because the earlier timestamp lies outside the defined business hours.
Example: "1970-01-05 10:00" (Mon 10:00)
-
Matplotlib representation (all hours counted):
Thu 1970-01-01 24h (00:00 - 24:00) + Fri 1970-01-02 24h (00:00 - 24:00) + Sat 1970-01-03 24h (00:00 - 24:00) + Sun 1970-01-04 24h (00:00 - 24:00) + Mon 1970-01-05 10h (00:00 - 10:00) --------------------------------------- = 106h (Total hours since epoch) / 24h --------------------------------------- = 4.41666... (matplotlib coordinate) -
Busdayaxis representation:
- We assume here that business hours are from 9:00 to 17:00. This can be configured by setting
ax.set_xscale("busday", bushours=(9, 17)).
To get the floating-point representation of "1970-01-05 10:00" (Mon 10:00), we count the business hours that have elapsed since 1970-01-01 00:00:
Thu 1970-01-01 8h (9:00 - 17:00) + Fri 1970-01-02 8h (9:00 - 17:00) + Sat 1970-01-03 0h + Sun 1970-01-04 0h + Mon 1970-01-05 1h (09:00 - 10:00) --------------------------------------- = 17h (business hours since epoch) / 24h --------------------------------------- = 0.708333... (busdayaxis coordinate) - We assume here that business hours are from 9:00 to 17:00. This can be configured by setting
Usage
There are two equivalent ways to apply the scale:
String-based
Requires a prior call to busdayaxis.register_scale().
Pass the registered name "busday" to set_xscale along with keyword arguments taken by BusdayScale. The axis parameter is excluded as it is automatically provided by the ax.set_xscale() call.
import datetime
import matplotlib.pyplot as plt
import busdayaxis

busdayaxis.register_scale()  # register once at the start of your script

fig, ax = plt.subplots()
ax.plot(dates, values)

ax.set_xscale("busday")  # compress weekends (Mon–Fri default)
# or
ax.set_xscale("busday", bushours=(9, 17))           # numeric hours
ax.set_xscale("busday", bushours=("09:00", "17:00"))  # ISO time strings
ax.set_xscale("busday", bushours=(datetime.time(9), datetime.time(17)))  # datetime.time
# or
ax.set_xscale(  # per-day business hours
    "busday", bushours={"Mon": (9, 17), "Fri": (9, 16)}
)
# or
ax.set_xscale(  # custom week mask and holidays
    "busday",
    weekmask="Sun Mon Tue Wed Thu",
    holidays=["2025-01-01"]
)
Class-based
Instantiate BusdayScale directly and pass it to set_xscale. No prior
register_scale() call needed. The class is fully typed, so IDEs provide
parameter completion and inline documentation.
from busdayaxis import BusdayScale

ax.set_xscale(BusdayScale(ax.xaxis))  # compress weekends (Mon–Fri default)
# or
ax.set_xscale(  # compress weekends + overnight gaps
    BusdayScale(ax.xaxis, bushours=(9, 17))
)
# or
ax.set_xscale(  # per-day business hours
    BusdayScale(ax.xaxis, bushours={"Mon": (9, 17), "Fri": (9, 16)})
)
# or
ax.set_xscale(  # custom week mask and holidays
    BusdayScale(ax.xaxis, weekmask="Sun Mon Tue Wed Thu", holidays=["2025-01-01"])
)
The default BusdayScale(ax.xaxis) is equivalent to ax.set_xscale("busday"): both compress Saturdays and Sundays while leaving all other time visible.
Custom tick placement
busdayaxis provides business-day-aware wrappers for every standard Matplotlib date locator. Each wrapper delegates tick placement to the underlying locator and then filters out any ticks that fall on non-business days or outside active business hours.
busdayaxis locator |
Wraps |
|---|---|
AutoDateLocator |
mdates.AutoDateLocator |
WeekdayLocator |
mdates.WeekdayLocator |
DayLocator |
mdates.DayLocator |
HourLocator |
mdates.HourLocator |
MinuteLocator |
mdates.MinuteLocator |
SecondLocator |
mdates.SecondLocator |
MicrosecondLocator |
mdates.MicrosecondLocator |
MidBusdayLocator |
(custom — see below) |
All locators read the weekmask, holidays, and bushours configuration directly from the axis, so they automatically stay in sync with the active BusdayScale.
You can also wrap any third-party or custom locator with the base BusdayLocator:
import matplotlib.dates as mdates
import busdayaxis

ax.set_xscale("busday", bushours=(9, 17))

# Hourly ticks only within business hours
ax.xaxis.set_major_locator(busdayaxis.HourLocator())

# Every other business day
ax.xaxis.set_major_locator(busdayaxis.DayLocator(interval=2))

# Every Monday that is a business day
ax.xaxis.set_major_locator(busdayaxis.WeekdayLocator(byweekday=mdates.MO))

# Wrap a custom locator
ax.xaxis.set_major_locator(busdayaxis.BusdayLocator(my_custom_locator))
MidBusdayLocator
MidBusdayLocator is a special locator that places one tick at the midpoint of the business session for each business day. It is not a filter wrapper — it computes midpoints directly from the bushours configuration, including per-day schedules.
Its primary use is centering day labels inside each session:
ax.set_xscale("busday", bushours=(9, 17))

# Major ticks at session boundaries, minor ticks centred for day labels
ax.xaxis.set_minor_locator(busdayaxis.MidBusdayLocator())
ax.xaxis.set_minor_formatter(mdates.DateFormatter("%a"))
License
BSD 3-Clause