Note
Click here to download the full example code
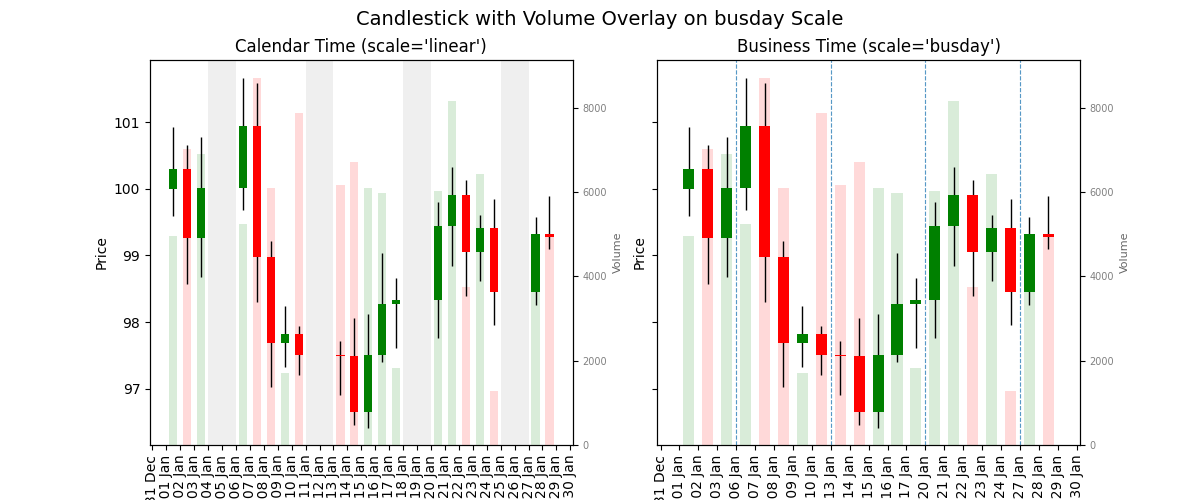
Candlestick with Volume Overlay
Out:
[<matplotlib.lines.Line2D object at 0x11718b110>, <matplotlib.lines.Line2D object at 0x11718b250>, <matplotlib.lines.Line2D object at 0x11718b390>, <matplotlib.lines.Line2D object at 0x11718b4d0>]
import matplotlib.dates as mdates
import matplotlib.pyplot as plt
import numpy as np
import pandas as pd

import busdayaxis

rng = np.random.default_rng(42)

dates = pd.bdate_range("2025-01-01", periods=20)
draw_times = dates + pd.Timedelta(hours=12)

returns = rng.normal(0, 0.01, len(dates))
close = 100 * (1 + pd.Series(returns, index=dates)).cumprod()
open_ = close.shift(1).fillna(100)
high = np.maximum(open_.values, close.values) + rng.uniform(0.1, 0.8, len(dates))
low = np.minimum(open_.values, close.values) - rng.uniform(0.1, 0.8, len(dates))

colors = ["green" if c >= o else "red" for c, o in zip(close.values, open_.values)]
body_bottom = np.minimum(open_.values, close.values)
body_height = np.abs(close.values - open_.values)

volume = rng.integers(1_000, 10_000, len(dates))

full_days = pd.date_range(dates.min().normalize(), dates.max().normalize(), freq="D")
bar_width = pd.Timedelta(hours=14)

fig, (ax1, ax2) = plt.subplots(1, 2, figsize=(12, 5), sharey=True)
fig.suptitle("Candlestick with Volume Overlay on busday Scale", fontsize=14)

# Create twin axes for volume background
ax1_vol = ax1.twinx()
ax2_vol = ax2.twinx()


def _draw(ax_price, ax_vol):
    # Volume in background — draw first so it appears behind candles
    ax_vol.bar(
        draw_times,
        volume,
        width=bar_width,
        color=colors,
        alpha=0.15,
        zorder=1,
    )
    ax_vol.set_ylabel("Volume", fontsize=8, alpha=0.6)
    ax_vol.tick_params(axis="y", labelsize=7, labelcolor="grey")

    # Price candles on top
    ax_price.vlines(draw_times, low, high, linewidth=1, color="black", zorder=3)
    ax_price.bar(
        draw_times,
        body_height,
        bottom=body_bottom,
        width=bar_width,
        color=colors,
        zorder=4,
    )
    ax_price.set_ylabel("Price")

    # Ensure price renders above volume
    ax_price.set_zorder(ax_vol.get_zorder() + 1)
    ax_price.patch.set_visible(False)


# axis with default linear scale
_draw(ax1, ax1_vol)
ax1.set_title("Calendar Time (scale='linear')")
ax1.xaxis.set_major_locator(mdates.DayLocator())
ax1.xaxis.set_major_formatter(mdates.DateFormatter("%a %d %b"))
ax1.tick_params(axis="x", rotation=90)

for d in full_days:
    if d.weekday() == 5:  # Saturday
        ax1.axvspan(d, d + pd.Timedelta(days=2), color="grey", alpha=0.12, linewidth=0)

# axis with busday scale
_draw(ax2, ax2_vol)
ax2.set_title("Business Time (scale='busday')")
ax2.xaxis.set_major_locator(busdayaxis.DayLocator())
ax2.xaxis.set_major_formatter(mdates.DateFormatter("%a %d %b"))
ax2.tick_params(axis="x", rotation=90)

ax2.set_xscale("busday")
ax2_vol.set_xscale("busday")
busdayaxis.mark_gaps(ax2, alpha=0.5)
Total running time of the script: ( 0 minutes 0.165 seconds)
Download Python source code: plot_candles_volume_overlay.py
Download Jupyter notebook: plot_candles_volume_overlay.ipynb