Note
Click here to download the full example code
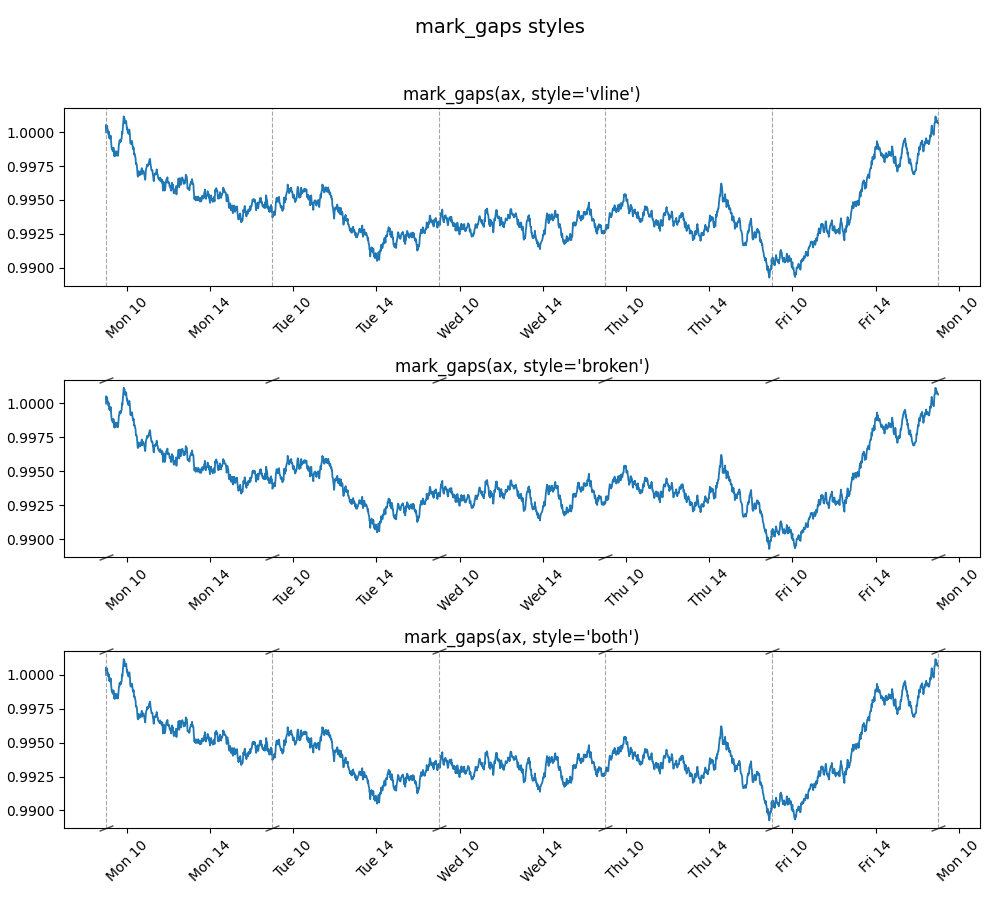
Mark Gap Boundaries
busdayaxis.mark_gaps draws visual indicators at every point where the axis
collapses a gap — end of session, overnight, weekend, or holiday. This signals to
the reader that time has been removed from the view.
Three styles are available:
"vline"— thin dashed vertical line at each seam (default)"broken"— diagonal slash marks at the top and bottom of the axes"both"— vline and broken marks combined
Core code:
busdayaxis.mark_gaps(ax)                        # vline (default)
busdayaxis.mark_gaps(ax, style="broken")        # slash marks only
busdayaxis.mark_gaps(ax, style="both")          # combined
import matplotlib.dates as mdates
import matplotlib.pyplot as plt
import numpy as np
import pandas as pd

import busdayaxis
Prepare dummy intraday data (Mon–Fri, 09:00–17:00)
num_days = 5
dates = pd.date_range("2025-01-06", periods=num_days * 24 * 60, freq="min")
returns = np.random.normal(0, 0.0002, len(dates))
returns[~np.is_busday(np.array(dates, dtype="datetime64[D]"))] = 0.0
returns[(dates.hour < 9) | (dates.hour >= 17)] = 0.0
prices = (1 + pd.Series(returns, index=dates)).cumprod()
Compare the three styles
fig, axes = plt.subplots(3, 1, figsize=(10, 9), sharey=True)
fig.suptitle("mark_gaps styles", fontsize=14)

styles = ["vline", "broken", "both"]
for ax, style in zip(axes, styles):
    ax.plot(dates, prices.values, linewidth=1.3)
    ax.set_xscale("busday", bushours=(9, 17))
    ax.xaxis.set_major_locator(busdayaxis.HourLocator(interval=4))
    ax.xaxis.set_major_formatter(mdates.DateFormatter("%a %H"))
    ax.tick_params(axis="x", rotation=45)
    ax.set_title(f"mark_gaps(ax, style={style!r})")
    busdayaxis.mark_gaps(ax, style=style, alpha=0.7)

_ = plt.tight_layout(rect=[0, 0, 1, 0.96])
Total running time of the script: ( 0 minutes 1.270 seconds)
Download Python source code: plot_8_mark_gaps.py