Note
Click here to download the full example code
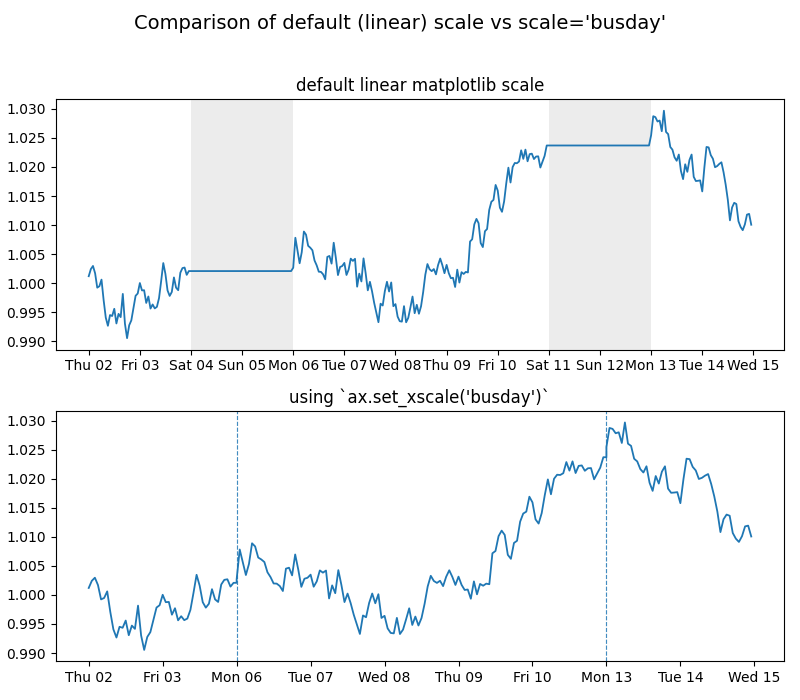
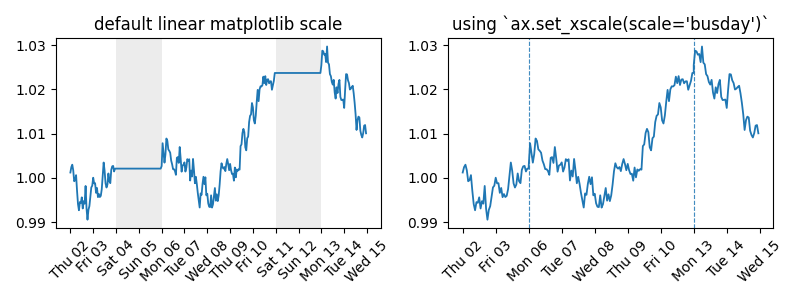
Remove Weekends
By default, weekends (Sat–Sun) are collapsed to zero width on the business axis. The price line jumps directly from Friday 24:00 to Monday 00:00, eliminating the flat segments visible on the calendar axis.
Core code:
ax.set_xscale("busday")
import matplotlib.dates as mdates
import matplotlib.pyplot as plt
import numpy as np
import pandas as pd

import busdayaxis

# prepare dummy data
num_days = 13
dates = pd.date_range("2025-01-02", periods=num_days * 24, freq="h")
returns = np.random.normal(0, 0.002, len(dates))
returns[~np.is_busday(np.array(dates, dtype="datetime64[D]"))] = 0.0
prices = (1 + pd.Series(returns, index=dates)).cumprod()


fig, (ax1, ax2) = plt.subplots(2, 1, figsize=(8, 7), sharey=True)
fig.suptitle("Comparison of default (linear) scale vs scale='busday'", fontsize=14)

# axis with default linear scale
ax1.plot(dates, prices.values, linewidth=1.3)
ax1.set_title("default linear matplotlib scale")
ax1.xaxis.set_major_locator(mdates.DayLocator())
ax1.xaxis.set_major_formatter(mdates.DateFormatter("%a %d"))

# axis with business scale
ax2.plot(dates, prices.values, linewidth=1.3)
ax2.set_xscale("busday")
ax2.set_title("using `ax.set_xscale('busday')`")
ax2.xaxis.set_major_locator(busdayaxis.DayLocator())
ax2.xaxis.set_major_formatter(mdates.DateFormatter("%a %d"))


# Shade weekends on linear scale
full_days = pd.date_range(dates.min().normalize(), dates.max().normalize(), freq="D")
for d in full_days:
    if d.weekday() == 5:  # Saturday
        ax1.axvspan(d, d + pd.Timedelta(days=2), color="grey", alpha=0.15, linewidth=0)
busdayaxis.mark_gaps(ax2, alpha=0.6)


_ = plt.tight_layout(rect=[0, 0, 1, 0.96])
Plot for README
fig, (ax1, ax2) = plt.subplots(1, 2, figsize=(8, 3))

# axis with default linear scale
ax1.plot(dates, prices.values, linewidth=1.3)
ax1.set_title("default linear matplotlib scale")
ax1.xaxis.set_major_locator(mdates.DayLocator())
ax1.xaxis.set_major_formatter(mdates.DateFormatter("%a %d"))
ax1.tick_params(axis="x", rotation=45)

# axis with business scale
ax2.plot(dates, prices.values, linewidth=1.3)
ax2.set_xscale("busday")
ax2.set_title("using `ax.set_xscale(scale='busday')`")
ax2.xaxis.set_major_locator(busdayaxis.DayLocator())
ax2.xaxis.set_major_formatter(mdates.DateFormatter("%a %d"))
ax2.tick_params(axis="x", rotation=45)


# Shade weekends on linear scale
full_days = pd.date_range(dates.min().normalize(), dates.max().normalize(), freq="D")
for d in full_days:
    if d.weekday() == 5:  # Saturday
        ax1.axvspan(d, d + pd.Timedelta(days=2), color="grey", alpha=0.15, linewidth=0)
busdayaxis.mark_gaps(ax2, alpha=0.6)

plt.tight_layout(rect=[0, 0, 1, 1])
_ = plt.savefig("../docs/assets/remove_weekend.png", dpi=300)
Total running time of the script: ( 0 minutes 0.969 seconds)
Download Python source code: plot_0_remove_weekend.py