Note
Click here to download the full example code
Holidays from Exchange Calendar
busdayaxis.holidays_from_exchange builds the holidays= list automatically
from a real exchange calendar, so you don't have to maintain the dates by hand.
It supports both pandas_market_calendars and exchange_calendars — the
function duck-types the calendar object and picks the right calling convention.
Optional dependency
This example requires pandas_market_calendars::
pip install pandas_market_calendars
exchange_calendars is equally supported:
pip install exchange_calendars
Core code:
import pandas_market_calendars as mcal
cal = mcal.get_calendar("NYSE")
holidays = busdayaxis.holidays_from_exchange(cal, "2025-01-01", "2025-01-31")
ax.set_xscale("busday", holidays=holidays)
import matplotlib.dates as mdates
import matplotlib.pyplot as plt
import numpy as np
import pandas as pd
import pandas_market_calendars as mcal

import busdayaxis
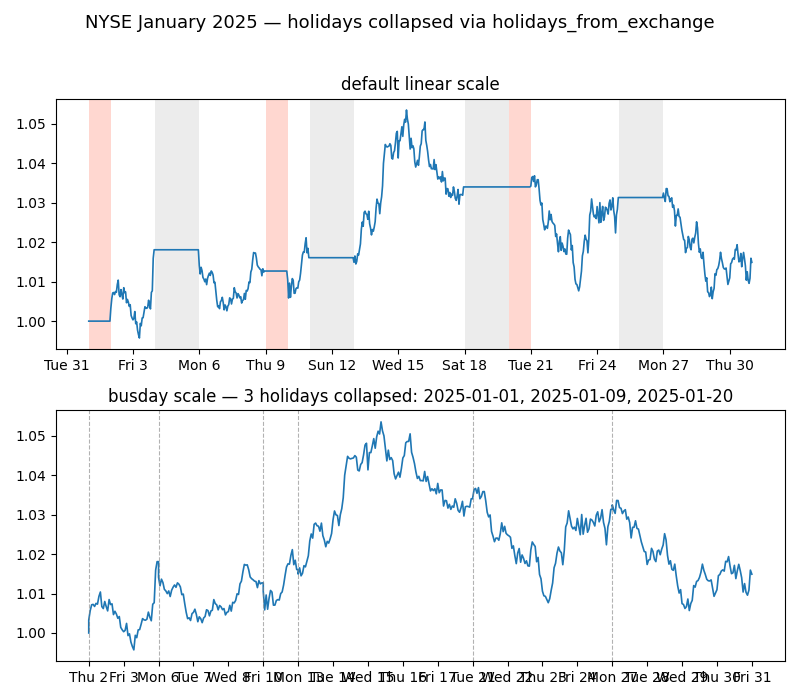
Build the holiday list from the NYSE calendar. January 2025 has two NYSE holidays: New Year's Day (Jan 1) and MLK Day (Jan 20).
cal = mcal.get_calendar("NYSE")
holidays = busdayaxis.holidays_from_exchange(cal, "2025-01-01", "2025-01-31")
Prepare dummy price data for January 2025
dates = pd.date_range("2025-01-01", "2025-01-31", freq="h")
returns = np.random.normal(0, 0.002, len(dates))
returns[~np.is_busday(np.array(dates, dtype="datetime64[D]"), holidays=holidays)] = 0.0
prices = (1 + pd.Series(returns, index=dates)).cumprod()


fig, (ax1, ax2) = plt.subplots(2, 1, figsize=(8, 7), sharey=True)
fig.suptitle(
    "NYSE January 2025 — holidays collapsed via holidays_from_exchange", fontsize=13
)

# default linear scale
ax1.plot(dates, prices.values, linewidth=1.2)
ax1.set_title("default linear scale")
ax1.xaxis.set_major_locator(mdates.DayLocator(interval=3))
ax1.xaxis.set_major_formatter(mdates.DateFormatter("%a %-d"))

# shade holidays and weekends on the linear axis
full_days = pd.date_range("2025-01-01", "2025-01-31", freq="D")
for d in full_days:
    if d.weekday() == 5:
        ax1.axvspan(d, d + pd.Timedelta(days=2), color="grey", alpha=0.15, linewidth=0)
for h in holidays:
    ax1.axvspan(
        pd.Timestamp(h),
        pd.Timestamp(h) + pd.Timedelta(days=1),
        color="tomato",
        alpha=0.25,
        linewidth=0,
        label=h,
    )

# busday scale with exchange holidays collapsed
ax2.plot(dates, prices.values, linewidth=1.2)
ax2.set_xscale("busday", holidays=holidays)
ax2.set_title(
    f"busday scale — {len(holidays)} holidays collapsed: {', '.join(holidays)}"
)
ax2.xaxis.set_major_locator(busdayaxis.DayLocator())
ax2.xaxis.set_major_formatter(mdates.DateFormatter("%a %-d"))
busdayaxis.mark_gaps(ax2, alpha=0.6)

_ = plt.tight_layout(rect=[0, 0, 1, 0.96])
Total running time of the script: ( 0 minutes 0.384 seconds)
Download Python source code: plot_1b_holidays_from_exchange.py
Download Jupyter notebook: plot_1b_holidays_from_exchange.ipynb